Personal project
React Lifecycle Atlas
An explorable 3D map of how React renders, commits and cleans up.
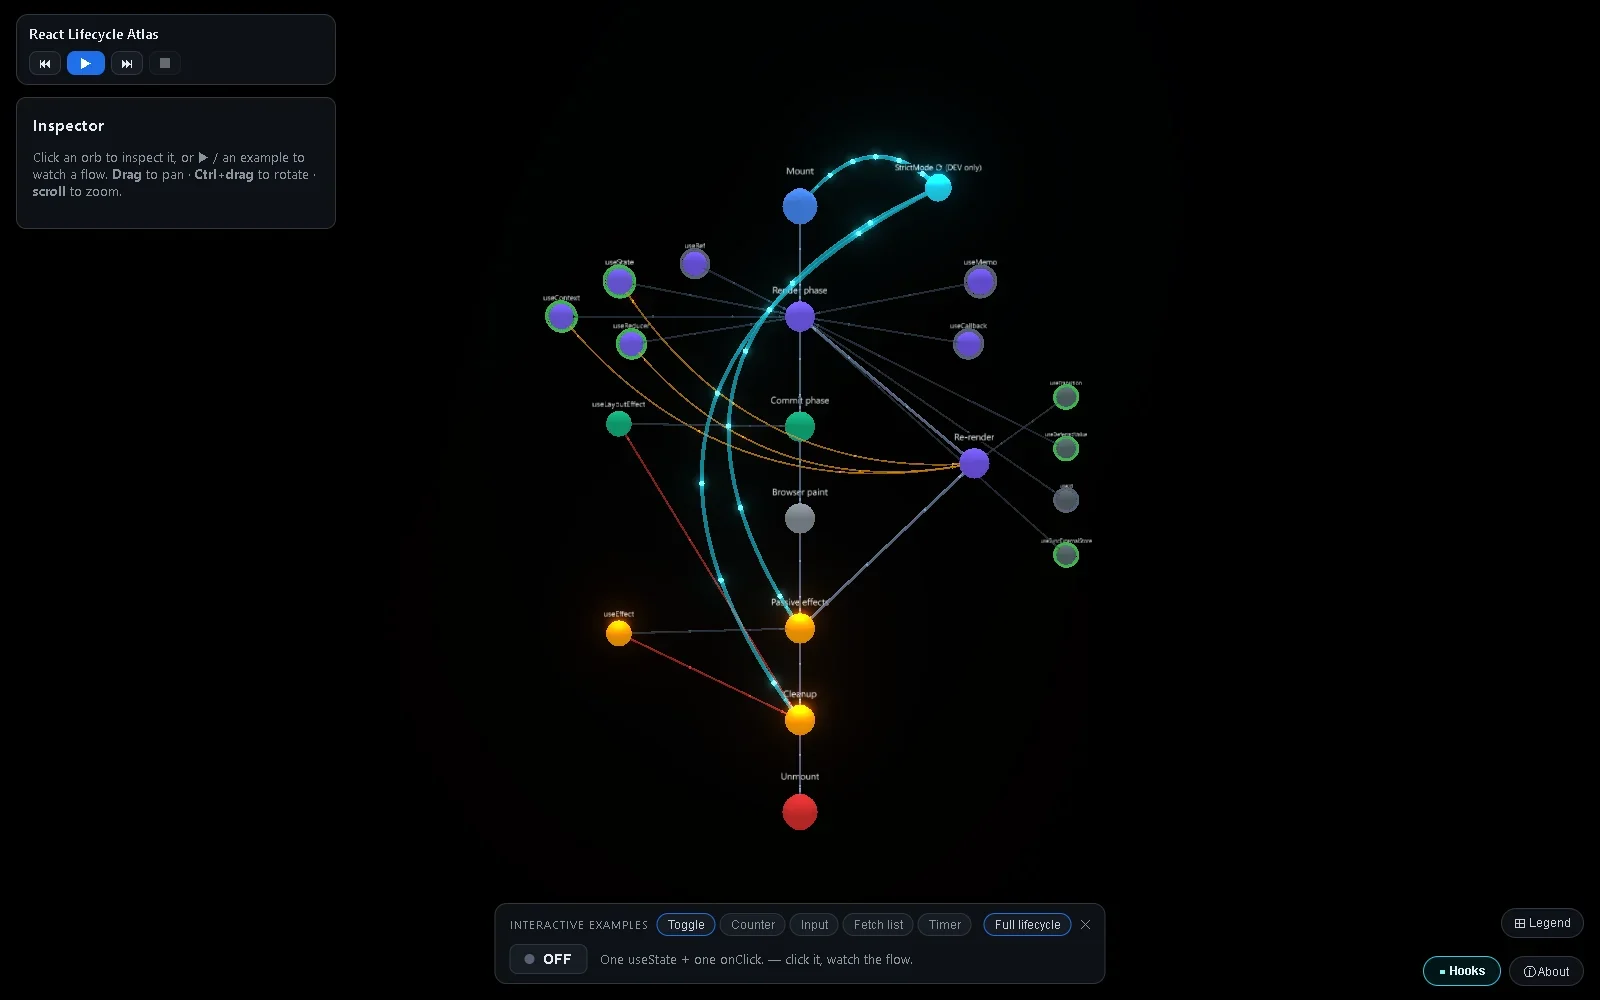
- 21 orbs for lifecycle events and hooks, joined by 28 links and colored by phase.
- Press play to watch the full lifecycle step through, or run one of five small examples (toggle, counter, input, fetch list or timer).
- A hooks cheat sheet covers 19 hooks in 8 groups, through React 19.
- Built in three days in July 2026 as a study tool.
Click an orb for its timing, a gotcha and a snippet. Click while an example is playing to pause it and step through by hand.
It uses the same graph libraries as Shaolin Observatory, with its own data and its own interface.
Credits: Graph drawing by react-force-graph-3d (Vasco Asturiano) on Three.js.